electrical resistivity tomography; multiple-point geostatistics; aquifer recharge; non-colocated data
Abstract :
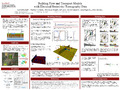
[en] Aquifer recharge and recovery (ARR) is the process of enhancing natural groundwater resources and recovering water for later use by constructing engineered conveyances. Insufficient understanding of lithological heterogeneity at ARR sites often hinders attempts to predict where and how quickly infiltrating water will flow in the subsurface, which can adversely affect the quality and quantity of available water in the ARR site. In this study, we explored the use of electrical resistivity tomography (ERT) to assist in characterizing lithological heterogeneity at an ARR site, so as to incorporate it into a flow and contaminant transport model. In this case, we had non-collocated well core log data and ERT data from a full-scale ARR basin. We compared three independent methods for producing conditional lithology-resistivity probability distributions: 1) a search template to relate the nearest logged well lithologies with ERT resistivity panels, given search criteria; 2) a maximum likelihood estimation (MLE) to match bimodal normal distributions to the histogram of each ERT line; and 3) variogram-based lithology indicator simulations constrained to well data. Each approach leverages Bayes’ Rule to estimate lithology probability given electrical resistivity. The simplest approach (method 1) yields an erroneous conditional probability function where sand dominates the conditional probability at nearly all resistivities, due in part to the strong presence of sand in the wells nearest the ERT lines. The approaches using MLE and lithology simulations (methods 2 and 3) produce similar, more realistic lithofacies probability functions. The range of resistivities where clay and sand overlap differs between methods 2 and 3: ranging between 100 and 200 ohm-m for method 2, and between 30 and 50 ohm-m for the method 3. These differences affect the posterior lithology distributions in multiple point geostatistical (MPS) simulations, and in turn, predictions of flow from models which integrate these results. To test the models, we can compare measured breakthrough times of recharged water at the site to groundwater flow simulation results using the lithofacies models created by each method. The methods described here can inform the integration of non-collocated geophysical data into a variety of applications.
Disciplines :
Geological, petroleum & mining engineering
Author, co-author :
Gottschalk, Ian; Stanford University
Hermans, Thomas ; Université de Liège > Département ArGEnCo > Géophysique appliquée
Knight, Rosemary; Stanford University
Caers, Jef; Stanford University
Cameron, David; Stanford University
Regnery, Julia; Colorado School of Mines
McCray, John; Colorado School of Mines
Language :
English
Title :
Building flow and transport models with electrical resistivity tomography data