Abstract :
[en] The emerging concept of hydrological connectivity is difficult to quantify. Some indices have been proposed. The most cited is Borselli’s one. It gives the advantage to visualize connectivity at watershed scale with very few inputs. But it is not a dynamic index and the resulting map is not time dependent. However, vegetation cover changes through year and possibly affects the connectivity dynamics. The objective of this poster is to show the evolution of the CI during the year looking at a few “strategic” times. Moreover, the study permits to identify a few “key locations” in the watershed, for example permanent disconnections or at the opposite constantly connected fields.
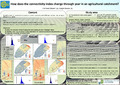
The CI was calculated in a 124ha catchment (Hevillers), in the loess belt, in Belgium. Land use is agricultural with mostly cereals, sugar beets and potatoes, little area with wood, road, path or grass strip. Used weighting factor is soil loss ratio. It is between 0 and 1 and translates the protection offered to the soil by the crop.
In winter (January), cereals have the most connected fields because of almost bare soils. Cover crops on sugar beets and potatoes fields decrease connectivity, except for one big field not far from the outlet. But rainfalls are generally not so erosive during this period. In spring (March and May), the cereals have a decreasing CI with plants growth covering the soil. On the opposite, sugar beets and potatoes are planted and bare soils in spring involve much higher connectivity index. The effect of grass strip is strong for sugar beet field situated uphill and underlines the importance of such mitigation measures. In summer (July), the whole watershed is much more disconnected and it does not represent the most risky part of the year in terms of erosion. The end of the year is related to harvesting and consequent bare soil in September for potatoes and November for the rest.
In conclusion, the IC is an easy tool to estimate connectivity in a watershed. With the evolution during the year using soil loss ratio in the calculation, it permits to visualize dynamically the connectivity pattern and to localize erosive parts of the catchment for the crop rotation. With a global view on several years, it could be helpful to erosion managers to think about best long-term location of mitigation measures in the watershed.