
  | Saghir, A., Akber Abbasi, S., & Faraz, A. (2021). The exact method for designing the Maxwell chart with estimated parameter. Communications in Statistics: Simulation and Computation, 50 (1), 270-281. doi:10.1080/03610918.2018.1554114  Peer Reviewed verified by ORBi Peer Reviewed verified by ORBi |
  | Saghir, A., Aslam, M., Faraz, A., Ahmad, L., & Heuchenne, C. (2020). Monitoring process variation using modified EWMA. Quality and Reliability Engineering International, 36 (1), 328-339. doi:10.1002/qre.2576 Peer Reviewed verified by ORBi |
 | Faraz, A., Saniga, E., & Montgomery, D. (2019). Percentile-based control chart design with an application to Shewhart X̅ and S2 control charts. Quality and Reliability Engineering International, 35 (1), 116-126. doi:10.1002/qre.2384 Peer Reviewed verified by ORBi |
 | Vakilian, F., Amiri, A., & Faraz, A. (2018). The guaranteed adaptive c-charts with estimated parameter. Quality and Reliability Engineering International, 34 (8), 1575-1589. doi:10.1002/qre.2342 Peer Reviewed verified by ORBi |
 | Saghir, A., & Faraz, A. (2018). Approximate design and performance of the robust control charts for monitoring dispersion in Phase I. Quality and Reliability Engineering International, 34 (2). doi:10.1002/qre.2246 Peer Reviewed verified by ORBi |
 | Saadatmelli, A., Moghadam, M. B., Seif, A., & Faraz, A. (2018). Economic design of control charts with multiple assignable causes under Burr XII shock model. Communications in Statistics: Theory and Methods, 43 (1), 500-522. doi:10.1080/03610926.2017.1414262 Peer Reviewed verified by ORBi |
 | Saadatmelli, A., Seif, A., Moghadam, M. B., & Faraz, A. (2018). Economic statistical design of a multivariate control chart under a Burr XII shock model with multiple assignable causes. Journal of Statistical Computation and Simulation, 88 (11), 2111-2136. doi:10.1080/00949655.2018.1450877 Peer Reviewed verified by ORBi |
 | Faraz, A., Sanders, N., Zacharia, Z., & Gerschberger, M. (2018). Monitoring type B buyer–supplier relationships. International Journal of Production Research, 56 (18), 6225-6239. doi:10.1080/00207543.2018.1444285 Peer Reviewed verified by ORBi |
 | Foster, E., Faraz, A., & Heuchenne, C. (2018). Statistically Bundled Shewhart Control Charts for Monitoring Delivery Chains Systems. European Journal of Industrial Engineering. Peer Reviewed verified by ORBi |
 | Faraz, A., Heuchenne, C., & Saniga, E. (2018). An exact method for designing Shewhart and S2 control charts to guarantee in-control performance. International Journal of Production Research, 56, 2570-2584. doi:10.1080/00207543.2017.1384580 Peer Reviewed verified by ORBi |
 | Faraz, A., Heuchenne, C., & Saniga, E. (2017). The np Chart with Guaranteed In-control Average Run Lengths. Quality and Reliability Engineering International, 33 (5), 1057-1066. doi:10.1002/qre.2091 Peer Reviewed verified by ORBi |
Faraz, A., Zacharia, Z., & Gerschberger, M. (September 2016). Are your strategic buyer-supplier relationships under control? [Paper presentation]. Council of Supply Chain Management Professionals (CSCMP)-Educators conference, Orlando, Florida, United States. |
 | Faraz, A., & Heuchenne, C. (2016). The np- Control Charts with the Guaranteed In-Control Performance. ORBi-University of Liège. https://orbi.uliege.be/handle/2268/184538. |
 | Faraz, A., Treiblmaier, H., & Gerschberger, M. (17 June 2016). Monitoring partnership networks- A graph theory approach [Paper presentation]. The 23rd EurOMA conference, Oslo, Norway. |
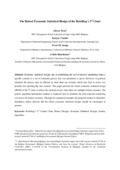 | Faraz, A., Chalaki, K., Saniga, E., & Heuchenne, C. (2016). The Robust Economic Statistical Design of the Hotelling’s T^2 Chart. Communications in Statistics: Theory and Methods. doi:10.1080/03610926.2014.972574 Peer Reviewed verified by ORBi |
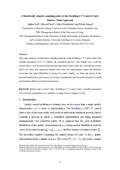 | Seif, A., Faraz, A., Heuchenne, C., & Saniga, E. (2016). A Statistically adaptive sampling policy to the Hotelling's T2 Control Chart: Markov Chain Approach. Communications in Statistics: Theory and Methods. doi:10.1080/03610926.2014.911910 Peer Reviewed verified by ORBi |
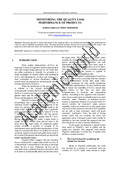 | Faraz, A., & Treiblmaier, H. (03 November 2015). Monitoring The quality Loss Performance of Products [Paper presentation]. 7th International Conference on Management and Information Technology, Bangkok, Thailand. |
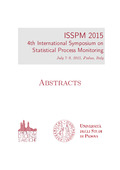 | Faraz, A., Heuchenne, C., & Woodall, W. H. (08 July 2015). Shewhart Control Charts with Guaranteed In-Control Performance [Paper presentation]. The 4th International Symposium on Statistical Process Monitoring, Padua,, Italy. |
Heuchenne, C., Faraz, A., & Saniga, E. (02 June 2015). Monitoring supply chains with multivariate control charts: an economic-statistical design approach [Paper presentation]. Seminar at HEC Lausanne. |
 | Faraz, A., Seif, A., & Sadeghifar. (June 2015). Evaluation of the Economic Statistical Design of the Multivariate T2 Control Chart with Multiple Variable Sampling Intervals Scheme: NSGA-II Approach. Journal of Statistical Computation and Simulation, 85 (12), 2442-2455. doi:10.1080/00949655.2014.931404 Peer Reviewed verified by ORBi |
 | Faraz, A., Saniga, E., & Heuchenne, C. (2015). Shewhart Control Charts for Monitoring Reliability with Weibull Lifetimes. Quality and Reliability Engineering International, 31, 1565-1574. doi:10.1002/qre.1692 Peer Reviewed verified by ORBi |
Saniga, E., Davis, D., Faraz, A., McWilliams, T., & Lucas, J. (2015). Characteristics of Economically Designed CUSUM and \bar{X} Control Charts. In S. Knoth & W. Schmid (Eds.), Frontiers in Statistical Quality Control 11 (pp. 201 - 217). Springer International Publishing. doi:10.1007/978-3-319-12355-4_13 Peer reviewed |
 | Faraz, A., Heuchenne, C., & Woodall, W. (2015). Guaranteed Conditional Performance of the S2 Control Chart with Estimated Parameters. International Journal of Production Research. doi:10.1080/00207543.2015.1008112 Peer Reviewed verified by ORBi |
 | Celano, G., CASTAGLIOLA, P., Faraz, A., & Fichera, S. (December 2014). Statistical performance of a control chart monitoring the ratio of two normal variables. Quality and Reliability Engineering International, 30 (8), 1361-1377. doi:10.1002/qre.1558 Peer Reviewed verified by ORBi |
 | Celano, G., Faraz, A., & Saniga, E. (December 2014). Control Charts monitoring product’s loss to society. Quality and Reliability Engineering International, 30 (8), 1393-1407. doi:10.1002/qre.1562 Peer Reviewed verified by ORBi |
 | Seif, A., Faraz, A., & Saniga, E. (02 November 2014). Economic Statistical Design of the VP( X) ̅ Control Charts for Monitoring a Process under Non-normality. International Journal of Production Research, 53 (14), 4218-4230. doi:10.1080/00207543.2014.986298 Peer Reviewed verified by ORBi |
 | Faraz, A., Heuchenne, C., & Seif, A. (04 June 2014). The application of the NSGA-II optimization method in designing control charts [Paper presentation]. International Conference on engineering and Applied Sciences optimization, Kos, Greece. |
 | Faraz, A., Celano, G., Heuchenne, C., Saniga, E., & Fichera, S. (June 2014). The variable parameters T2 chart with run rules. Statistical Papers, 55 (4), 933-950. doi:10.1007/s00362-013-0537-7 Peer Reviewed verified by ORBi |
Faraz, A. (14 March 2014). Monitoring Delivery Networks in supply chains [Paper presentation]. International Conference on Supply Chain Management, Rajasthan, India. |
 | Faraz, A., Heuchenne, C., Saniga, E., & Costa, A. F. B. (2014). Double Objective Economic Statistical Design of the VPT2 Control Chart: Wald’s identity approach. Journal of Statistical Computation and Simulation, 84, 2123-2137. doi:10.1080/00949655.2013.784315 Peer Reviewed verified by ORBi |
Saniga, E., Davis, D., Faraz, A., McWilliams, T., & Lucas, J. (22 August 2013). Characteristics of Economically Designed CUSUM and \bar{X} Control Charts [Paper presentation]. XIth International Workshop on Intelligent Statistical Quality Control, Sydney, Australia. |
 | Faraz, A., Heuchenne, C., Saniga, E., & Costa, A. F. B. (09 July 2013). Double-objective Economic Statistical Design of the Adaptive T2 Control Charts [Paper presentation]. 3rd International Symposium on Statistical Process Control, University of Pireaus, Greece. |
 | Faraz, A., Heuchenne, C., Saniga, E., & Foster, E. (July 2013). Monitoring delivery chains using multivariate control charts. European Journal of Operational Research, 228 (1), 282–289. doi:10.1016/j.ejor.2013.01.038 Peer Reviewed verified by ORBi |
Faraz, A. (17 May 2013). Monitoring distribution networks in supply chains [Paper presentation]. International Conference on Supply Chain Management, Bangalore, India. |
 | Faraz, A., & Saniga, E. (April 2013). Multiobjective Genetic Algorithm Approach to the Economic Statistical Design of Control Charts with an application to Xbar and S2 charts. Quality and Reliability Engineering International, 29 (3), 407-415. doi:10.1002/qre.1390 Peer Reviewed verified by ORBi |
 | Faraz, A., Heuchenne, C., & Saniga, E. (November 2012). Optimal T2 control chart with double sampling scheme - an alternative to the MEWMA chart. Quality and Reliability Engineering International, 28 (7), 751-760. doi:10.1002/qre.1268 Peer Reviewed verified by ORBi |
 | SEIF, A., & Faraz, A. (15 January 2012). A modified economic-statistical design of the VP multivariate control charts [Paper presentation]. International Conference on Mathematical and Statistical Sciences, Zurich, Switzerland. |
 | Faraz, A., kazemzadeh, R. B., Parsian, A., & Moghadam, M. B. (January 2012). On the advantages of economically designed the Hotelling’s T2 control chart with variable sample sizes and sampling intervals. Quality and Quantity, 46 (1), 39-53. doi:10.1007/s11135-010-9325-9 Peer Reviewed verified by ORBi |
 | Faraz, A., & Seif, A. (2012). A Meta Model to Optimally Design the VSI T2 Control Chart. International Journal of Applied Operational Research, 1 (3), 53-69. Peer Reviewed verified by ORBi |
| Faraz, A., Heuchenne, C., Davis, D. E., & Saniga, E. (December 2011). The Economic and Statistical Designs of Control charts for Censored and Non-Normal Data [Paper presentation]. University of Delaware Scientific meeting, United States. |
Faraz, A., & Heuchenne, C. (2011). Economic Design of Control Charts In Presence of Censored Data [Paper presentation]. Academic Meetings and a Visit to University of Delaware, Delaware, United States. |
 | Seif, A., Moghadam, M. B., Faraz, A., & Heuchenne, C. (November 2011). Statistical Merits and Economic Evaluation of T2 Control Charts with the VSSC Scheme. Arabian Journal for Science and Engineering, 36 (7), 1461-1470. doi:10.1007/s13369-011-0124-y Peer Reviewed verified by ORBi |
 | Seif, A., Faraz, A., Heuchenne, C., Saniga, E., & Moghadam, M. B. (November 2011). A modified economic-statistical design of the T2 control chart with variable sample sizes and control limits. Journal of Applied Statistics, 38 (11), 2459-2469. doi:10.1080/02664763.2011.559205 Peer Reviewed verified by ORBi |
 | Faraz, A., & Saniga, E. (November 2011). A unification and some corrections to Markov chain approaches to develop variable ratio sampling scheme control charts. Statistical Papers, 52 (4), 799-811. doi:10.1007/s00362-009-0288-7 Peer Reviewed verified by ORBi |
 | Faraz, A., & Heuchenne, C. (24 September 2011). MULTIOBJECTIVE DESIGN OF CONTROL CHARTS [Paper presentation]. International Conference on Applied Statistics, BLED, Slovenia. |
 | Faraz, A., Heuchenne, C., Saniga, E., & Foster, E. (13 July 2011). Monitoring delivery chains in a supply chain using multivariate control charts [Paper presentation]. 2th International Symposium on Statistical Process Control, Rio de Janerio, Brazil. |
 | Faraz, A., Chalaki, K., & Moghadam, M. B. (April 2011). On the properties of the hotelling’s T2 control chart with variable sampling intervals. Quality and Quantity, 45 (3), 579-586. doi:10.1007/s11135-010-9314-z Peer Reviewed verified by ORBi |
 | Faraz, A., & Saniga, E. (March 2011). Economic Statistical Design of a T2 Control Chart with Double Warning Lines. Quality and Reliability Engineering International, 27 (2), 125-139. doi:10.1002/qre.1095 Peer Reviewed verified by ORBi |
 | Faraz, A., Saniga, E., & kazemzadeh, R. B. (December 2010). Economic and Economical Statistical Design of Hotelling’s T2 Control Chart with Two-State Adaptive Sample Size. Journal of Statistical Computation and Simulation, 80 (12), 1299 – 1316. doi:10.1080/00949650903062574 Peer Reviewed verified by ORBi |
 | torabian, M., Moghadam, M. B., & Faraz, A. (November 2010). ECONOMICALLY DESIGNED HOTELLING’S T2 CONTROL CHART USING VSICL SCHEME. Arabian Journal for Science and Engineering, 35 (2), 251–263. Peer Reviewed verified by ORBi |
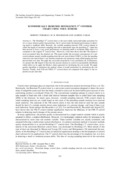
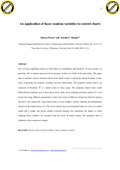 | Faraz, A., & Shapirob, A. (October 2010). An application of fuzzy random variables to control charts. Fuzzy Sets and Systems, 161 (20), 2684–2694. doi:10.1016/j.fss.2010.05.004 Peer Reviewed verified by ORBi |
 | Faraz, A., Kazemzadeh, R. B., Moghadam, M. B., & BAZDAR, A. (August 2010). Constructing a fuzzy Shewhart control chart for variables when uncertainty and randomness are combined. Quality and Quantity, 44 (5), 905-914. doi:10.1007/s11135-009-9244-9 Peer Reviewed verified by ORBi |
 | Faraz, A., Kazemzadeh, R. B., Heuchenne, C., & Saniga, E. (2010). The Optimal Design of the VSI T2 Control Chart. Journal of Iranian Statistical Society, 9 (1), 1-19. Peer reviewed |
 | Faraz, A., Heuchenne, C., & Saniga, E. (2010). A Meta Model to Optimal Design the VSI T2 Chart. |
| Faraz, A., & Kazemzadeh, R. B. (2010). Statistical process control and delivery chains. International Journal of Industrial Engineering and Production Research, 21 (3), 55-66. Peer Reviewed verified by ORBi |
Faraz, A. (2009). The applications of Genetic Algorithms in NP-hard optimization problems. |
 | Seif, A., Faraz, A., & Torabian, M. (2009). Improving the power of out of control states detection in multivariate processes using variable sampling intervals policy. Journal of Applied Mathematics, 23, 37-50. Peer reviewed |
 | Torabian, M., Faraz, A., & Seif, A. (2009). Statistical design of the Hotelling’s T2 control chart with variable ratio sampling scheme using genetic algorithms. Journal of Applied Mathematics, 6 (22), 77-89. Peer reviewed |
 | Faraz, A., & Moghadam, M. B. (2009). Hotelling’s T 2 control chart with two adaptive sample sizes. Quality and Quantity, 43 (6), 903–912. doi:10.1007/s11135-008-9167-x Peer Reviewed verified by ORBi |
 | Faraz, A., & MOGHADAM, M. B. (2007). Fuzzy Control Chart A Better Alternative for Shewhart Average Chart. Quality and Quantity, 41 (3), 375-385. doi:10.1007/s11135-006-9007-9 Peer Reviewed verified by ORBi |
 | Faraz, A., & Parsian, A. (2006). Hotelling's T 2 control chart with double warning lines. Statistical Papers, 47 (4), 569-593. doi:10.1007/s00362-006-0307-x Peer Reviewed verified by ORBi |
 | Jafarinia, Faraz, A., Akhoundzadeh, S., & Gahgaei, Z. (2003). Investigation of the range and effective factors on protein energy malnutrition based on nutritional classification of rural zone of Arak in children less than five years. Arak Medical University Journal, 6 (2(23)), 7-13. Peer Reviewed verified by ORBi |